
· 5 min read
Danai Vergeti

The Federal Statistical Office (FSO) is the national service provider of statistical observations in areas of national, social, economic, and environmental importance of the Swiss Confederation supporting policy making and decision support at operational, tactical and strategic level.

FSO is responsible for compiling and imparting user-friendly information on important areas of life in the Swiss society offering more than 15.5K data assets supported in three national languages. These data are currently available in a “human-readable” format in Excel files.

The challenge

Unfortunately, the Excel format prevents applications from easily consuming this data for analysis. Excel files include titles, multiple columns or tables, metadata, aesthetical components to improve human readability like line breaks or documentation.

Our approach

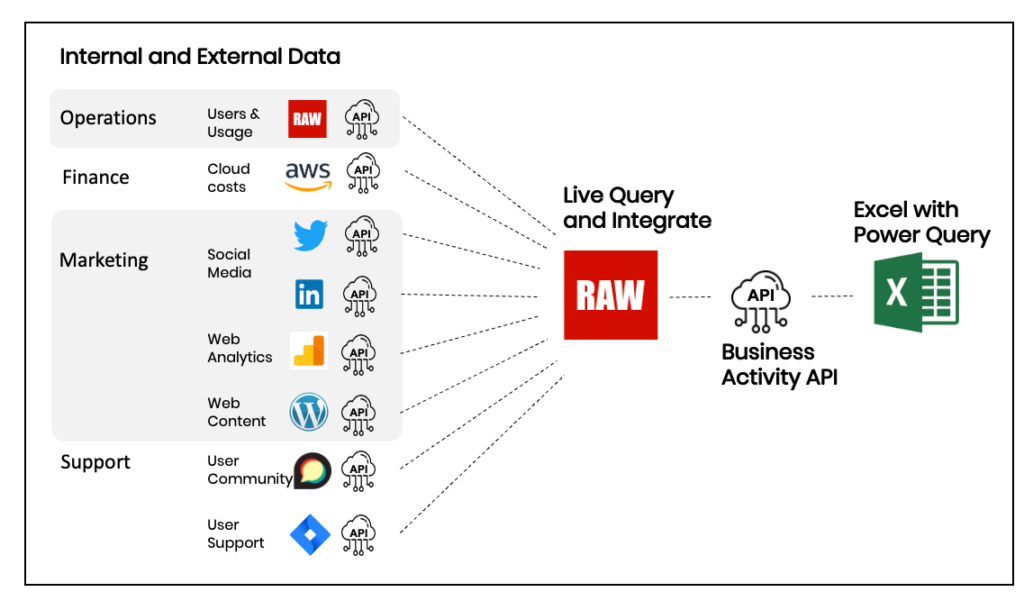
RAW enables the FSO to easily turn their vast collection of Excel data assets into accessible, ready-to-use machine-readable JSON datasets, provided as web services, which are more suited for data analysis.

The data assets were accessed, queried and processed using the Snapi language, a data manipulation language designed to deliver data quickly from multidisciplinary data sources. The data query and transformation process takes place in real-time by applying a number of dynamic transformation rules based on the Excel tables hierarchy as well as performing schema detection using inference. Out of all 37758 data assets, 37272 fit in the asset types and all of them were successfully transformed. Quality checks have been made on a selected subset, which is 2 samples per category per language. For these assets, RAW adopted an automated measurement and dimension naming checking system against the actual Excel assets. This QA approach can be extended with manual insertion of ground values (measurements in Excel files) for comparison against those in the JSON files.

The results

The converted data is now available in the RAW platform. Here's a brief guide in case you are interested in querying Switzerland's official statistical datasets.

RAW Platform

The data assets can be consumed using three API endpoints:

  1. Retrieve a specific FSO asset given an FSO number in the original Excel format;
  2. Retrieve a specific FSO asset given an FSO number but in the converted JSON format;
  3. Search for assets given a set of criteria.

In particular, it's now possible to search across all Excel datasets, which was not possible in the past.

Let's look at each of these endpoints in detail.

To retrieve specific FSO asset given an FSO number in the Excel format use, e.g: https://sso.api.raw-labs.com/asset/excel?fsoNr=su-t-vz15-k-18.

To retrieve a specific FSO asset given an FSO number in JSON format use, e.g: https://sso.api.raw-labs.com/asset/json?fsoNr=su-d-vz18-b-0203.

The JSON assets contain the following information:

  • Asset metadata: Information about FSO number, title, original URL of the excel file and various metadata used by the FSO (language, prodima & inquiry codes, period and embargo).
  • Actual dataset: in the form of an array of records, each of which contains the following information:
    • Administrative area (canton, commune or district)
    • Actual measurement: copy of the respective excel worksheet
    • Vertical dimension: hierarchical keys of the first column of each worksheet
    • Horizontal dimension: flat (or hierarchical) keys found in first header rows

All assets are found in three languages (German, French and Italian), as indicated by their filenames. Below you can see the first lines for asset su-d-vz18-b-0203:

// 20230210160345
// https://sso.api.raw-labs.com/asset/json?fsoNr=su-d-vz18-k-10

{
"originAssetUrl": "https://dam-api.bfs.admin.ch/hub/api/dam/assets/97915/master",
"fsoNr": "su-d-vz18-k-10",
"language": "de",
"title": "Kanton Freiburg: Wohnbevölkerung nach Hauptsprache, Religion, Nationalität und weiteren Merkmalen",
"period": "2000",
"prodimaCode": "01",
"inquiryCode": "VZ",
"embargo": "09-Jan-2013",
"dataset": [
{
"measurment": "241706",
"Ausgewählte Merkmale I": "Wohnbevölkerung",
"Amtsbezirk": "Canton de Fribourg",
"Wohnbevölkerung_type": "Wohnbevölkerung_Total",
"Ausgewählte Merkmale II": "Wohnbevölkerung"
},
{
"measurment": "119837",
"Ausgewählte Merkmale I": "Wohnbevölkerung",
"Amtsbezirk": "Canton de Fribourg",
"Wohnbevölkerung_type": "Wohnbevölkerung_Männer",
"Ausgewählte Merkmale II": "Wohnbevölkerung"
},
{
"measurment": "121869",
"Ausgewählte Merkmale I": "Wohnbevölkerung",
"Amtsbezirk": "Canton de Fribourg",
"Wohnbevölkerung_type": "Wohnbevölkerung_Frauen",
"Ausgewählte Merkmale II": "Wohnbevölkerung"
},...

Finally, you can now search for assets given a set of criteria. This endpoint implements search for assets given a set of criteria. Supported criteria can be the following:

  • fsoNr
  • prodimaCode
  • inquiryCode
  • language
  • titlePhrase
  • period
  • embargo

prodimaCode and inquiryCode definitions are provided by FSO as metadata. Search criteria are combined together in a logical AND relation. For example, if both titlePhrase and period are defined as input arguments, then the final results should contain both values. Users can retrieve the available search criteria values by calling one of the following classification retrieval services:

  • prodimaCode: https://sso.api.raw-labs.com/classifications/prodima
  • inquiryCode: https://sso.api.raw-labs.com/classifications/inquiry
  • language: https://sso.api.raw-labs.com/classifications/language
  • period: https://sso.api.raw-labs.com/classifications/period
  • embargo: https://sso.api.raw-labs.com/classifications/embargo

Regarding titlePhrase and fsoNr, simple words (or parts of words) can be defined. If the title or FSO number respectively contain the given phrase(s) then the asset is returned.

For example, to list all assets in french use https://sso.api.raw-labs.com/assets?language=fr.

To list all assets in french with title containing the phrase Bâtiments use https://sso.api.raw-labs.com/assets?language=fr&titlePhrase=Bâtiments.

To list all assets with 01.02.05 as prodimaCode with FSO number containing the fragment vz-AKL5_HG use https://sso.api.raw-labs.com/assets?prodimaCode=01.02.05&fsoNr=vz-AKL5_HG.

To learn more contact us.

· 7 min read
Cesar Matos

Big and complex data are the fuel for the Internet Of Things (IOT). The RAW platform with its comprehensice support for complex datasets is ideally suited as a real-time data integration and analytics platform for IOT. Let's see how!

The Scenario

We are a site reliability engineer managing control software for industrial machines. Recently we are having suspicious software crashes, and we want to create a data service to collect diagnostics/data to help us identify the cause(s).

The data

We have operational data stored in a database and in a S3 bucket with several formats: log files, CSV and JSON.

We have the following data sources:

  • Machine status information logged periodically and stored in a PostgreSQL database.
  • Software crashes from Docker, these come in a JSON format and output by familiar docker inspect commands.
  • Sensor data from the machines, exported in CSV.
  • Error Logs, stored in an S3 bucket, in familiar log file formats that require parsing.

Machine Status

Machines are being monitored and their status and location are being stored in a PostgreSQL database. This table looks like this:

idmodelagestatuslatitudelongitude
1model318OK46.5154716.644706
2model47OK46.5647826.551355
3model38OK46.5379846.629472
4model37OK46.5705006.591574

To read it we can use PostgreSQL.InferAndRead. Here we create a function where you pass a machine ID and returns the corresponding record from the table.

machine(id: int) =
let
data = PostgreSQL.InferAndRead(
"raw",
"example",
"machines",
host = "example-psql.raw-labs.com",
username = "pgsql_guest",
password = "..."
)
in
Collection.First(Collection.Filter(data, (x) -> x.id == id))

We are reading data from the database "raw", schema "example" and table "machines". The output for id=1 is:

{
"id": 1,
"model": "model3",
"age": 18,
"status": "OK",
"latitude": 46.515471,
"longitude": 6.644706
}

Software crashes from Docker

Each machine has a specific service controlling it.

These services are deployed using docker. The status of this software can be extracted from the output of the "docker-inspect" command.

The output of "docker-inspect" is a (long) JSON document, e.g.:

 {
"Id": "806f4355da135542086c3fdb1365ed7ec4df45223c056d77635b33befee296c3",
"Name": "machine 98",
"Created": "2015-11-26T06:00:00.000",
"Path": "bash",
"Image": "sha256:9873176a8ff5ac192ce4d7df8a403787558b9f3981a4c4d74afb3edceeda451c",
"Driver": "overlay2",
"Platform": "linux",
"Args": [
"arg1"
],
"State": {
"Status": "running",
"Running": false,
"Paused": false,
"Restarting": false,
"OOMKilled": false,
"Dead": true,
"Pid": 86629,
"ExitCode": 3,
"Error": "comp3",
"StartedAt": "2015-11-26T06:00:00.000",
"FinishedAt": "2015-11-26T06:00:00.000"
},
"ResolvConfPath": "/var/lib/docker/containers/806f4355da135542086c3fdb1365ed7ec4df45223c056d77635b33befee296c3/resolv.conf",
"HostnamePath": "/var/lib/docker/containers/806f4355da135542086c3fdb1365ed7ec4df45223c056d77635b33befee296c3/hostname",
"HostsPath": "/var/lib/docker/containers/806f4355da135542086c3fdb1365ed7ec4df45223c056d77635b33befee296c3/hosts",
"LogPath": "/var/lib/docker/containers/806f4355da135542086c3fdb1365ed7ec4df45223c056d77635b33befee296c3/806f4355da135542086c3fdb1365ed7ec4df45223c056d77635b33befee296c3-json.log",
"RestartCount": 0,

We can get the corresponding machine from the Name field. The field State has an exit code, which tells us if the software finished successfully or not.

The following function extracts the relevant information in an easier-to-consume tabular form.

failures(id: int) =
let
dockerInspect = Json.InferAndRead(
"s3://raw-tutorial/ipython-demos/predictive-maintenance/docker-inspect-output.json"
),
summary = Collection.Transform(
dockerInspect,
(x) ->
{
MachineId: Int.From(String.SubString(x.Name, 9, 1)),
ExitCode: x.State.ExitCode,
Error: x.State.Error,
FinishedAt: x.State.FinishedAt
}
)
in
Collection.Filter(
summary,
(x) -> x.ExitCode > 0 and x.MachineId == id
)
[
{
"MachineId": 1,
"ExitCode": 4,
"Error": "comp4",
"FinishedAt": "2015-01-05T06:00:00.000"
},
{
"MachineId": 1,
"ExitCode": 1,
"Error": "comp1",
"FinishedAt": "2015-03-06T06:00:00.000"
},
{
"MachineId": 1,
"ExitCode": 2,
"Error": "comp2",
"FinishedAt": "2015-04-20T06:00:00.000"
},
{
"MachineId": 1,
"ExitCode": 4,
"Error": "comp4",
"FinishedAt": "2015-06-19T06:00:00.000"
},

Error logs

Errors are collected from logs. These logs are uploaded to a logging service, which in turn collects and saves all records into an S3 bucket.

2015-01-01T05:54:15 WARN vibration close to treshold, check instrumentation panel ASAP.
2015-01-01T05:54:58 INFO calibration at 100%, checking inner sub-systems.
2015-01-01T05:55:41 ERROR voltage not measured for more than 25 seconds, reboot machine.
2015-01-01T05:56:24 INFO cleaning procedure schedulled soon, performing sub task 111.
2015-01-01T05:57:07 INFO task 155 schedulled soon, preparing next task.
2015-01-01T05:57:50 WARN inner temp increasing rapidly, please check internet connection.
2015-01-01T05:58:33 INFO cleaning procedure starting, calibrating.
2015-01-01T06:00:00 WARN machine 24 with error=error1
2015-01-01T05:54:15 ERROR inner temp not measured for more than 16 seconds, please call 041 123 456 789.

This file has a lot of data, but right now, we are only interested in lines that report machine errors. We can use Collection.Filter and a regex to remove all unwanted lines, like this:

let
data = String.ReadLines(
"s3://raw-tutorial/ipython-demos/predictive-maintenance/machine_logs.log"
),
filtered = Collection.Filter(
data,
(x) ->
Regex.Matches( x, "(.*) WARN machine (\\d+) with error=(\\w+).*")
)
in
filtered

Output:

[
"2015-01-01T06:00:00 WARN machine 24 with error=error1",
"2015-01-01T06:00:00 WARN machine 73 with error=error4",
"2015-01-01T06:00:00 WARN machine 81 with error=error1",
"2015-01-01T07:00:00 WARN machine 43 with error=error3",
"2015-01-01T08:00:00 WARN machine 14 with error=error4",
"2015-01-01T08:00:00 WARN machine 76 with error=error5"

Now we can use Regex.Groups to extract all the relevant fields. This is how the final function looks like:

errors(id: int) =
let
data = String.ReadLines(
"s3://raw-tutorial/ipython-demos/predictive-maintenance/machine_logs.log"
),
filtered = Collection.Filter(
data,
(x) ->
Regex.Matches(
x,
"(.*) WARN machine (\\d+) with error=(\\w+).*"
)
),
parsed = Collection.Transform(
filtered,
(x) ->
let
groups = Regex.Groups(
x,
"(.*) WARN machine (\\d+) with error=(\\w+).*"
)
in
{
machineId: Int.From(List.Get(groups, 1)),
timestamp: Timestamp.Parse(
List.Get(groups, 0),
"y-M-d'T'H:m:s"
),
error: List.Get(groups, 2)
}
)
in
Collection.Filter(parsed, (x) -> x.machineId == id)

errors(1)

Output:

[
{
"machineId": 1,
"timestamp": "2015-01-03T07:00:00.000",
"error": "error1"
},
{
"machineId": 1,
"timestamp": "2015-01-03T20:00:00.000",
"error": "error3"
},
{
"machineId": 1,
"timestamp": "2015-01-04T06:00:00.000",
"error": "error5"
},

Sensor data

Sensor data is collected and stored in CSV files. We can read it using the following function:

telemetry(id: int) =
Collection.Filter(
Csv.InferAndRead(
"s3://raw-tutorial/ipython-demos/predictive-maintenance/telemetry-iso-time.csv"
),
(x) -> x.machineID == id
)

Output:

[
{
"datetime": "1/1/2015 6:00:00 AM",
"machineID": 1,
"volt": 176.217853015625,
"rotate": 418.504078221616,
"pressure": 113.077935462083,
"vibration": 45.0876857639276
},
{
"datetime": "1/1/2015 7:00:00 AM",
"machineID": 1,
"volt": 162.87922289706,
"rotate": 402.747489565395,
"pressure": 95.4605253823187,
"vibration": 43.4139726834815
},

Collecting our information for analysis

Now we have all the sources defined, we can start to dig into the data to get answers. For a given machine (id), we would like to collect some information about the last failure. We are interested in:

  • Basic information such as the error, timestamp, machine age, model etc. from ‘failures’ (docker json file) and ‘machines’ (database table).
  • Sensor data of the 6 hours before the crash (‘telemetry’ from our sensor csv file).
  • Errors of the 6 hours before the crash ('errors' from log files).

Let's create a function lastFailureData which aggregates all necessary data from each one of functions created before.

lastFailureData(machineId: int) =
let
machineData = machine(machineId),
failureData = failures(machineId),
lastFailure = Collection.Max(failureData.FinishedAt),
startMeasure = Timestamp.SubtractInterval(
lastFailure,
Interval.Build(hours = 6)
),
lastFailureRecord = Collection.First(
Collection.Filter(
failureData,
(x) -> x.FinishedAt == lastFailure
)
),
lastTelemetry = Collection.Filter(
telemetry(machineId),
(x) ->
x.datetime < lastFailure and x.datetime > startMeasure
),
lastErrors = Collection.Filter(
errors(machineId),
(x) ->
x.timestamp < lastFailure and x.timestamp > startMeasure
)
in
{
lastFailure: lastFailureRecord,
machineData: machineData,
lastTelemetry: lastTelemetry,
lastErrors: lastErrors
}

lastFailureData(1)

Output:

{
"machineId": 1,
"age": 18,
"model": "model3",
"lastFailure": {
"MachineId": 1,
"ExitCode": 4,
"Error": "comp4",
"FinishedAt": "2015-12-31T06:00:00.000"
},
"lastTelemetry": [
{
"datetime": "2015-12-31T01:00:00.000",
"machineID": 1,
"volt": 147.720615260015,
"rotate": 493.074645851158,
"pressure": 104.81366016439,
"vibration": 41.2714171061972
},
{
"datetime": "2015-12-31T02:00:00.000",
"machineID": 1,
"volt": 153.93048096902,
"rotate": 353.466012177296,
"pressure": 99.6570720990314,
"vibration": 42.806176552987
},
{
"datetime": "2015-12-31T03:00:00.000",
"machineID": 1,
"volt": 175.481807900786,
"rotate": 475.951631160907,
"pressure": 88.7452579535092,
"vibration": 39.9863347521755
},
{
"datetime": "2015-12-31T04:00:00.000",
"machineID": 1,
"volt": 179.860806868559,
"rotate": 461.478368479999,
"pressure": 120.299989462607,
"vibration": 35.8235042398746
},
{
"datetime": "2015-12-31T05:00:00.000",
"machineID": 1,
"volt": 172.645716803532,
"rotate": 386.985814610685,
"pressure": 96.0729702714405,
"vibration": 35.7556427077587
}
],
"lastErrors": []
}

Want to learn more? Join us on Discord to leave your thoughts.

· 2 min read
Jeremy Posner
Benjamin Gaidioz

Many companies are moving their in-scope data to Snowflake for advanced analytics, but they may encounter several scenarios where their data isn't readily available in the platform.

  1. The required data may simply not be in Snowflake yet.
  2. Or that data is needed on a one-off basis, and loading it into Snowflake would be time-consuming.
  3. Or the necessary data belongs to external sources.

The same of course applies to any other Cloud database, including RedShift, BigQuery, etc. Whichever you choose, their aim is to grow a captive audience who keep paying for more compute and storage, thus building up their Data Gravity (see my earlier blog on this topic).

RAW can help you get the job done without the hassle of importing data. We query all data in place. No moving, No downloading. It’s faster to get to results and iterate. We expose data as APIs. Data products your users can access without needing to know where the source lies.

We've prepared a demo use case that shows you step by step how a Snowflake table of addresses to be corrected, can be augmented with a column produced from an external system. The underlying logic is as straightforward as the code below.

We have created a demo use case that provides a step-by-step guide on how to validate and standardize addresses stored in a Snowflake table, using an external system. The logic underlying this process is straightforward, as illustrated by the code segment below.

let
addresses = Snowflake.InferAndRead("DB01", "CRM", "ADDRESS")
in
Collection.Transform(
addresses,
(a) ->
Record.AddField(
a,
// custom call to an external web service!
fixed = validate(a.country, a.city, a.street_address)
)
)

Curious to see it all? Clone and customize this example now!

· 4 min read
Cesar Matos

At RAW, our development and operational teams often need to work together to debug those harder bugs. Sometimes our standard pipelines don't quite capture all the necessary information and we need to dig a bit deeper. This means Ops sharing logs with Devs. But how to do it securely?

So inspired by our own needs, here's a simple example on how to accomplish that with RAW.

Say you want to share data from a log file with others. But you cannot share sensitive information, and you also need to limit the data displayed depending on the user or application calling the endpoint.

To limit access in the RAW platform, we can use scopes. Scopes are a list of strings that you define and that can be assigned to users or API keys. So you can create a scope called "monitoring" and assigned it to a collection of users and API keys; this scope can then be used to limit the access to the API; for more information on this, check our API Key management documentation page.

For our example, each log file has 3 levels of log statements; INFO, WARN and ERROR. We want to implement the following data access rules:

  • Users with the scope admin scope can see all statements.
  • Users with the scope monitoring can see INFO and WARN statements.
  • Users without any relevant scopes can only see INFO statements.

Here's an excerpt of the log file:

2015-01-01T05:54:15 WARN vibration close to treshold, check instrumentation panel ASAP.
2015-01-01T05:54:58 INFO calibration at 100%, checking inner sub-systems.
2015-01-01T05:55:41 ERROR voltage not measured for more than 25 seconds, reboot machine.
2015-01-01T05:56:24 INFO cleaning procedure schedulled soon, performing sub task 111.
2015-01-01T05:57:07 INFO task 155 schedulled soon, preparing next task.

Parsing the file

In Snapi, we use String.ReadLines to split the file into lines of text and Regex.Groups to extract the timestamp, level and message from each line. Like this:

parse() =
let
lines = String.ReadLines(
"s3://raw-tutorial/ipython-demos/predictive-maintenance/machine_logs.log"
),
parsed = Collection.Transform(lines, l ->
let
groups = Regex.Groups(l,"""(\d+-\d+-\d+T\d+:\d+:\d+) (\w+) (.*)"""),
timestamp = Timestamp.Parse(List.Get(groups, 0),"yyyy-M-d\'T\'H:m:s"),
level = List.Get(groups, 1),
message = List.Get(groups, 2)
in
{timestamp: timestamp, level: level, message: message}
)
in
parsed
Note

We are using a regex pattern to parse the file. Learn more about regex patterns here.

The output looks like:

[
{
"timestamp": "2015-01-01T05:54:15.000",
"level": "WARN",
"message": "vibration close to treshold, check instrumentation panel ASAP."
},
{
"timestamp": "2015-01-01T05:54:58.000",
"level": "INFO",
"message": "calibration at 100%, checking inner sub-systems."
},
{
"timestamp": "2015-01-01T05:55:41.000",
"level": "ERROR",
"message": "voltage not measured for more than 25 seconds, reboot machine."
},
{
"timestamp": "2015-01-01T05:56:24.000",
"level": "INFO",
"message": "cleaning procedure schedulled soon, performing sub task 111."
},
{
"timestamp": "2015-01-01T05:57:07.000",
"level": "INFO",
"message": "task 155 schedulled soon, preparing next task."
}
]

Filtering by scope

Now that we have parsed the file we can start implementing our data restriction rules. We will use the built-in function Environment.Scopes to get the caller scopes and filter the data accordingly. Something like this:

Collection.Filter(
parsed,
(x) ->
if List.Contains(Environment.Scopes(), "admin")
then true
else if List.Contains(Environment.Scopes(), "monitoring")
then x.level == "WARN" or x.level == "INFO"
else
x.level == "INFO"
)

Here is all the code together:

main() =
let
lines = String.ReadLines(
"s3://raw-tutorial/ipython-demos/predictive-maintenance/machine_logs.log"
),
parsed = Collection.Transform(
lines,
(l) ->
let
groups = Regex.Groups(
l,
"(\\d+-\\d+-\\d+T\\d+:\\d+:\\d+) (\\w+) (.*)"
),
timestamp = Timestamp.Parse(
List.Get(groups, 0),
"yyyy-M-d\'T\'H:m:s"
),
level = List.Get(groups, 1),
message = List.Get(groups, 2)
in
{timestamp: timestamp, level: level, message: message}
)
in
Collection.Filter(
parsed,
(x) ->
if List.Contains(Environment.Scopes(), "admin")
then true
else if List.Contains(Environment.Scopes(), "monitoring")
then x.level == "WARN" or x.level == "INFO"
else
x.level == "INFO"
)

Using API keys

API keys provide a secure way to give access to private endpoints to users without the necessary permissions (scopes) to access them.

We can create API keys with the scope monitoring or admin, and set the expiration time e.g. one day. We can now give this key to users, so they can see ERROR or WARN messages, and not even having to worry about revoking access, as it will happen by itself.

That's a much safer way to share logs with others!

For access to fully-working ready-to-use example, check our related demo data product here.

· 4 min read
Jeremy Posner

At RAW we eat our own dog food – that’s the best way to give immediate feedback to our Product and R&D teams – and of course test the latest updates that are coming thick and fast.

As an emerging software vendor, we’re interested in key business metrics, but also understanding user behaviours so we can iterate and improve quickly. We also need to measure our outbound efforts vs. results, and where best to focus our time and budget. Lastly, we don’t want to wait for data to be collated, cleaned, integrated – we want it now.

We use Snapi to connect to both our internal operational data and external data from software services that we use, and serve this up as an integrated data set via an API, which we then share around the company. Our users then connect to this API to pull out the data using many tools – such as an Excel Spreadsheet.

Let’s dig into how we created and operate this Business Activity API

Our Business Metrics & Data Sources

Here are some of our most important data sources and the metrics we want to get out:

  • RAW User Registrations, Logins and System Usage – from inside our own platform
  • Cloud Costs – from our AWS Billing Reports
  • Social Media metrics – we use Twitter and Linkedin
  • Website statistics (sessions, page hits and other Information) – we use Google Analytics
  • Web site additions (blogs, news, videos) – we use WordPress
  • Forum posts and other activity – we use Discourse
  • Support tickets, resolutions and other metrics – from JIRA

We use our platform to query these, directly from source, and serve up a Business Activity API which is then made available securely within the company – and read directly from an Excel spreadsheet with standard Power Query functionality.

All the data is live, up to the minute too. No batches. No waiting.

RAW Activity

Creating the Business Activity API

Because the result set we want is an integrated data set from many different sources, the top level API sits on top of multiple other APIs:

  • those that are already provided by vendors and can be queried directly, for instance Twitter and JIRA,
  • internal ones we implemented to conveniently wrap access to an underlying system, for example (an RDBMS or a storage system).

All this code is hosted in our GitHub. As we enhance the application and commit changesets to GitHub, our DataOps platform picks it up, validates it and deploy it instantaneously. You can read more about this over in our tutorial docs.

Using the Business Activity API

Now we have our API, we can call it using any method: Python, Curl, Java, etc. Here’s a Curl example:

curl 'https://api.raw-labs.com/v1/private/activity?datefrom=2022-06-01&dateto=2022-06-08&key=xxxxxxxxxxxxx'

That’s great for the techies, but this output is needed by more business facing people, and Excel and other end user tools are their friends. To use the API into Excel we can use standard Excel and Power Query functionality, via the dialogue box below (under “Data → Get Data → From Web” menu)

Excel

Excel is very easy to use, and many people are now comfortable with Power Query, refreshing external data sets, and even creating auto-refreshing, and parameterized calls to external data. You can of course use any BI / Reporting tool.

Our output uses standard Pivot Tables, which are fine for what we need, and flexible too. The data refresh comes from a standard “Data → Refresh All” button on the ribbon. Here’s some examples of the type of analysis, remembering that this data comes from multiple integrated sources:

Excel

Wrap Up

That’s it for this blog post – Hopefully you can see that it’s easy to use RAW to create a Business Activity API from your key data sets: operational, financial, marketing and support. The API which serves the data can be read from many popular tools, so dashboards are flexible and can grow as you need.

We are building the fastest API creation and data sharing solution. Share data with your colleagues internally, or your external partners, clients or suppliers. For more information, get in touch with us today, or browse our demo catalog.

· 2 min read
Jeremy Posner

There’s 50 billion web pages apparently. These could be your own web pages from your web site, or a customer, competitor, partner website(s), or even news feeds. These make plenty of choice for data sources which we can use.

But, how can we query this wealth of data? Most websites rely on RSS, a well known format to present updates to websites in a computer-readable format. RSS is an XML standard and despite the reports of the death of XML, there’s still plenty of XML in the news and publishing spaces. If we can query these, we can then analyze the news, live.

RSS often doesn't have the actual content, and there’s more metadata inside each page, so we can use RSS as a nice index, but we then need to traverse down to process more data.

Here's the plan to query this data:

  1. Query and order the XML, and extract metadata from each page;
  2. Pass the results to a text analysis API to return structured, semantic data (entity extraction) system;
  3. Aggregate up results for presentation.

This is a fairly standard pattern, and here we will use both the OpenGraph.io API for extracting page metadata, along with Google’s Language Entity Analysis API for the text extraction, but there are plenty of choices out there depending on what you want to do.

RAW lets you achieve this in a couple of lines only! Want to learn how? Check our related demo data product here for fully working example that queries the news live from CNN.

· One min read
Jeremy Posner

Data sharing is hot in 2022. Businesses sharing data are more likely to outperform those who do not (Gartner). But most are not sharing data and taking those opportunities, because of fear, culture or lack of expertise. At RAW Labs, we make it simple to share data using APIs.

For the full article read our Dataversity Blog. Here’s the summary below.

12 Benefits of Data Sharing as APIs

  1. Data is live and on-demand
  2. Users can get data they want, not just what’s sent
  3. Data can easily be served in different formats
  4. An API can be versioned as it matures
  5. Both users and computers can consume APIs easily
  6. Standards for APIs give interoperability and tooling options
  7. Avoid managing messy files
  8. API access is easily measured, metered, and audited
  9. An API can reflect your business
  10. APIs are database-independent
  11. An API is a contract
  12. APIs are testable

Read more here!

· 6 min read
Jeremy Posner

We live in a modern business world where agility is seen as one of the key ingredients to rising to the top of the competitive pack. Notable business successes, and failures, have occurred due to this one factor. It is all very well to spot trends, plan for a changing world, but another to be able to execute on that – respond faster to new business opportunities, changes in the market, customer needs, pandemics, or geopolitical events.

Agile organisations are the ones which are best placed to adapt and out-manoeuvre their competition and as businesses become ever more data-driven, this means needing to be more "agile with data" – but there are no absolute references for what this means in practice – since "data" is way too broad a concept. For references on the web try googling: "agile data delivery", "agile data modelling", "agile data governance", or "agile data science" – there will be many great articles and views.

Being agile means different things to different people, however at its core it’s the ability to create and respond quickly to change. And, in the data space, that means being able to source, produce, model, govern, process, analyse and use/act on data faster.

Many organisations mistake the need to be "agile with data" with empowerment of users to do whatever they want with data to grow the business. And as the number of tools and technologies grows to use more and more types of data more easily, it becomes easier to use, and abuse, data – make mistakes or violate company rules, policies or even break the law.

This unfettered data behaviour could be seen in SMBs, start-ups and scale-ups, and even some larger organisations – until, one day, an event occurs which causes them to think again. Here are typical scenarios:

  • Company floats, or bought by a public and/or regulated company
  • Company is affected by new regulations due to external change in rules
  • Company has an audit where issues are found due to data processing inadequacies
  • Company has a data breach
  • Company enters (or wants to enter) into a new market, and that market is regulated
  • Regulations and the data explosion make a perfect storm

In any of these situations (and there are more) – suddenly there are extra requirements to explain where data comes from, how it’s processed, used, by whom, for what, prove numbers are right, show that proper processes are in place, and policies are being adhered to. In short, demonstrate data control and governance. Greater data maturity. In many instances there were none of the aforementioned controls in place, and so everyone scrambles around, defending, deflecting and diverting from the main job of growing the business.

This problem is only going to get bigger. Over the last 10-15 years, we have seen two seismic shifts happen at the same time. Firstly an explosion of regulations that affect data (GDPR, CCPA, BCBS239, HIPAA, SOX, …a seemingly endless and growing list – more coming to big tech too), and, at the same time, data estates themselves have become a lot more complex:

  • More data (volume, velocity) and more types of data (variety, veracity) than ever – exponentially.
  • Data in more places (on-prem, public/private cloud, SaaS vendors) and in more physical devices
  • Technology choice explosion in ways to store, process and access data – the so called ‘modern data stack’ – of which so many varieties exist, you can see some great examples here
  • Data sourced, used, shared in many more ways and for more purposes than ever

So what’s the answer? How do you keep your agility with data, and exercise control in this complex and heavily scrutinised data world? Can you have your cake and eat it ?

Enter DataOps

Without regurgitating a DataOps definition here, adopting a DataOps approach can help with BOTH the control AND the agility concerns. DataOps seeks to provide tools, processes and structures to deal with the data explosion and the control environment. But you need to think differently about your data too. DataOps should be backed by a Data as a Product approach; a first class citizen of your business – meaning there is proper planning, management, ownership, control, feedback, measurement, audit and focus 100% on your users.

Whether you are implementing a modern data stack using a data lake, data lakehouse, data fabric, data mesh or the next incarnation in data architecture, the same basic tenets hold true. You need to manage data as a product, exercise control and governance at the same time as allowing increasing business agility. DataOps can then help deliver faster and better.

At RAW we build our product around a DataOps philosophy, Data as a Product, and Data as Code too, where the data and the code exhibit a duality, i.e. can be shared, reused, managed and consumed together. Our users create their data products as APIs with well-defined interfaces and controls.

The result is hugely accelerated delivery times, much faster iterations, complete control and audit of the whole data product delivery cycle, including sourcing, transforming, serving up bundles of data and code.

Let's get technical

RAW takes inspiration from software development where large groups of developers work together to produce a single software artefact. And just like in software development we use tools like Git and approaches like Continuous Integration to manage RAW code.

How does this work? RAW does not read "view definitions" from its own metadata tables like SQL engines traditionally do. Instead, it reads them from Git and every Git commit transitions all APIs to the new version, atomically. All your code evolves at once; it can be tested in a separate branch against test databases/systems, and you can use whatever CI or CD methodology that best fits your needs. As a user, you push the code to a Git repo, and RAW retrieves it and updates its state, atomically. Besides being a good solution to consistency and enabling a DataOps approach to testing and deployment, it also enables new use cases, such as sharing code and APIs in GitHub repositories for example. We can finally build, test, deploy and share data products that we trust.

· 5 min read
Jeremy Posner

DJ Patil defined a data product as “a product that facilitates an end goal through the use of data". But what are the many characteristics of a good Data Product? It’s a new space and we can learn a lot from other industries with very mature products.

Choose key characteristics that are important to you, and then quantitatively measure different options for delivering them. Here’s 4 characteristics that are important to our customers, and why they chose an API approach. For them, a Data Product should be:

  • Specified
  • Usable
  • Fit-for-purpose
  • Supported

... as deemed by the intended audience, i.e. those who the value proposition appeals to.

Let’s look at these in a little more depth, and see where APIs satisfy these well.

A Specified Data Product

An API can reflect your business, and most businesses are complex. Data structures are often complex too. A good API supports and reflects the business, can support complex structures well – often difficult in tables and columns.

Specification is not just about data structure, it’s about the way things are named and APIs allow you to use consistent nomenclature, no matter what the database says it’s called. There are specification standards for APIs - these allow interoperability and hence this gives you tooling options, so you’re no longer tied down to that old mainframe, or even that new cloud provider.

API docs have standards and are easy to generate along with the API. Documentation is critical to being able to specify correctly, and a good API has lots of great docs, those that show how to use it, with nice examples, test pages, etc. for a smooth onboarding process.

An API is a data contract plus a lot more. It communicates with people. It reduces ambiguity. It isolates changes in the underlying data stack, so you can keep evolving in a decentralised (and data mesh friendly) world.

A Usable Data Product

Usability of any product is key. Just ask Apple. When your product is data, ask yourself if it’s optimised for use by your users. Better still, ask them: Are they Excel-junkies? Data Scientists? BI tool users? Can they write SQL?

An API can serve data in different formats: JSON is common, but sometimes Tabular data, a CSV is easier, and other times it won’t work well, e.g. for large datasets you might want to return compressed data. API’s can be read directly by many tools, from Excel, to Tableau and everything in between.

Still using messy file transfers? APIs give users the data on demand and not when dropped into folders, and reduce operational burden along the way.

Whilst we are onto usability, it is worth noting that both users and computers can consume APIs, so you don’t always need two different mechanisms – having one API, with two different outputs may work well.

Lastly, API docs, if they are human and machine-readable, can be shared just like any other metadata to be made searchable by your users in an API Catalogue.

A Fit-for-Purpose Data Product

What the APIs purpose is, and the intended audience should be stated by the API Product Owner. Is the API intended for developers? is it for hobby-coders? or just for machines? One of our clients has users who are not sophisticated, so the API is simple. Another where they are professional developers, and so the API adds many more features.

Either way, as API’s are contracts, a good API has well-specified inputs and outputs, and therefore it is testable, with many mature software products that can integrate into your DevOps processes. You can test against APIs to ensure your build isn’t broken. That works nicely in a Data Mesh environment where multiple groups publish their APIs for each other.

The other side to being data contracts is that the quality of the data can be measured against the specification, via enhanced testing harnesses – not just testing structure, return codes, but also testing values. For instance testing that an ISO country code has a correct value which can be performed via another API.

A Supported Data Product

Like any good product, a Data Product is only as effective as its support. A key job of the API Product Owner is to ensure this supportability. Automate API documentation with the delivery of the API itself.

APIs can support versioning; there are a number of well-trodden paths for version management, including versioning in the path, in the header. It is often the case that multiple versions of an API are supported at one time. An API can announce itself as ‘deprecated’, and this allows graceful end of life support as a new version rolls in.

You can measure API consumption, just look at the logs – can see who is still on V1 when everyone is on V2. Furthermore it is possible to see what parameters, features or scope being used and also what’s not being used. Not so easy in a file. Also hard in most databases.

Finally, because APIs are database-independent, you are free to move your underlying data stack, perhaps it’s out of support, you move Cloud vendor, find something cheaper or a better set of technologies to deliver your API. We know one and you can get started here! 🙂

· 3 min read
Miguel Branco

At RAW Labs we are our mission to allow our users to "query all the data, anywhere". In doing this, we had to spend a lot of time researching query languages.

Querying all the data

SQL is the obvious candidate to build upon, but unfortunately, as discussed here, SQL is really built to query tabular data. Despite the best efforts from standards organization, retrofitting new data types and formats into SQL is far from ideal.

So the first step to query all the data is to define a richer data model, where in addition to tables of numbers, dates or text, we also support nested structures for instance. These are the constructs that enable us to truly support many of the datasets we see in the real world, where JSON, XML and other formats are prevalent.

Querying data anywhere

The next step in our mission - query data anywhere - requires us to rethink both the query language but also how and where it executes. Our goal is to query any data, anywhere, and this means the ability to query datasets stored remotely as well as discovering what those datasets are and what data they contain.

This is really hard to do in current systems. For instance, in SQL-based systems, users never query data anywhere; instead, tables and schemas are defined (and data is typically loaded) upfront. Even those database engines that allow users to read remote data still require schemas to be defined first.

So the next step in our mission is to provide facilities in the language to discover and query "never seen before" data, no matter where it is located.

And so Snapi is born!

And this is why we ended up creating a new query language at RAW Labs. It is called "Snapi" (it's snappy!) and you can learn more about it here. Snapi flagship features are:

  • the ability to query data directly from databases, files or web services, at source;
  • it is a declarative language, allowing for powerful optimizations;
  • it includes data discovery constructs to query never seen before data whose schema isn't known;
  • but it is also type safety;
  • it is a modern, secure language, with an advanced approach for handling errors that typically happen with dirty data;
  • it supports complex data types;
  • it is scalable.

Snapi is the result of a long-running academic research project at EPFL, which many publications to its name. It has now been turned into a core component of the RAW platform, which you can learn more about here.

As always, stay around to learn more or join us on Discord to leave your thoughts.

· 8 min read
Miguel Branco

Many years ago I was part of the team building the tools to help physicists access data for the Large Hadron Collider at CERN. I recall spending many hours sitting down with physicists, helping them navigate over a set of custom tools we had built so that they could track down which “physics events” they needed, download them locally and start their work. Helping them access data was, in essence, my role.

But as soon as we got through the various hurdles to get them the data they needed – which was hard enough, as there were petabytes of physics events, vast amounts of scripts, and home-grown tools – I then saw them struggling to process that data. Simple tasks like filtering events with some given set of physics properties was hard work. I recall contrasting what I saw – hand-rolled C++ code – with the world of relational databases and their powerful query optimizers. There were plenty of good reasons not to use any of these systems: data had a complex structure with plenty of hierarchies; scale was an issue; data ownership and ingestion required by traditional databases were all a no-go. But a lot was lost in the process.

What we were missing was a query engine that could query “all the data, anywhere”. By all the data I meant not just relational tables – the staple of today's data analysis tools – but data with complex deep hierarchical structures for example. Whilst most data can be modelled relationally as tables, there’s a level of complexity where it’s simply not helpful to do so, as it just makes it harder to understand. And by “anywhere” I meant data from any source, without having to download it or ingest it (i.e. replicate it) into another system.

Our solution at CERN was to build home-grown tools and plenty of processes. Since those days, NoSQL, NewSQL, virtual data warehouses, data lakes and cloud computing have made tremendous progress. But for the average user, querying “all the data, anywhere” is still an elusive goal. Much of what I saw back then, I got to relive years later when querying data lakes for instance. This problem – of querying “all the data, anywhere” – is the problem we have set ourselves to solve at RAW Labs.

Querying “all data”

SQL is the de facto standard for querying data. The reasons are manifold but at this point it is the most well-known language with broad support. There are a fundamental reasons that make SQL a nearly ideal query language.

To start, SQL is a declarative language. By this we mean that as a user of SQL you express the logic of a computation and not how it is done. A SQL user declares that “I want to join datasets A and B discarding all the data with those properties”. A user does not specify how that join should be computed: which algorithm should be used, or how the computation should be distributed in your machine or cluster, or even when the data files should be open or closed, or how much should be read into memory at any point.

Another property of SQL is the abstraction level it provides over the data. As a user of a database system you are not concerned how the data is stored – which format it is on -, nor how best to access it. This is all handled for you. Data can be cached in-memory, replicated on disk, or indexed in a variety of formats and all of that is transparent to you. The format can even evolve over time, transparently, bringing you additional performance benefits.

The declarative nature of the query language and the abstraction provided by database engines gives ample room for optimization. These are some of the most important reasons why SQL won the "query language" wars.

When SQL isn't enough

But, just as I saw at CERN, there are cases where SQL isn’t the right tool for the job. SQL in fact requires relational tables as its input data source. And yes, we can model all the data into tabular forms. There are even tools to transform complex nested structures into tables. But no matter how much we try, some data is just too clunky to fit into tables: deep hierarchies, matrices, complex document stores all have their reasons of existing for storing data.

There’s also SQL’s recent evolution. SQL is becoming too complex in ways that are, frankly, unhelpful to the users. For example, in recent years the SQL standard has had many extensions added. One example is the support for JSON, which is now part of the SQL:2016 standard. Under the new standard, to every operation on a JSON field must use JSON-specific operations, e.g. json_arrayagg or json_array_elements along with countless other specific functions. It is also a deviation of the original design principles of SQL because you now must write code that depends on the format of your data. If your data were to move from JSON to XML or Protobufs – even with the exact same schema – you would need completely different query code.

There are good reasons for how JSON support is implemented in SQL but in my opinion these have more to do with backward compatibility and legacy support than with providing users with the best possible query language. Consider the following example. Say you have the following JSON data with logs of transactions. Each transaction contains one or more entries:

[
{
"id": "xct1",
"entries": [
{
"id": "ee4192ffb6d2caa490a1",
"amount": 1200,
"created_at": 1426412340,
},
...
]
},
{
"id": "xct2",
"entries": [
{
"id": "de5192fab612d8a4a999",
"amount": 2000,
"created_at": 1426412779,
}
]
}
]

Now suppose we want to obtain the total amount, which requires scanning all elements in the JSON data and for each of them scan all entries.

Here’s how you’d perform that aggregation in PostgreSQL:

WITH entries AS(
SELECT json_array_elements(y->’details’) as e FROM data
)
SELECT sum((d->>’amount’)::int) FROM entries;

Note the use of JSON-specific elements for accessing “array elements”, another syntax for accessing object fields, as well as the need of casting types; not to mention the use of CTEs (WITH statement) for a seemingly simple operation.

This is hardly user-friendly. The JSON-specific fields also mean that the storage abstraction we so appreciated is being broken: you now must know your data is stored in JSON and what the specific operations to query JSON are. Same for XML, and others.

This is now far too complicated for the average user.

Can we do better? Absolutely. At RAW Labs – and before that, in a database research group at EPFL, Switzerland, where RAW was born – we’ve been thinking of query and data manipulations languages for the future. We will see more about this language, called Snapi in future posts but for a quick peek you can find plenty of examples of querying complex JSONs here.

Querying data “anywhere”

To query “all the data”, we first have to get to it. Over the years there have been many attempts at querying data from “anywhere”. Data integration, virtual data warehouses, and data lakes have all been recent attempts at solving this problem with the goal of providing a “single source of truth”.

Data integration and virtual data warehouses are based on the idea that data should be kept at source. On top of that, a layer – ideally virtual – is built that provides a unified view over the underlying data. Queries are sent to this layer which then splits and otherwise forwards them to the underlying systems. Data lakes turn this idea around and instead provide a single place where all types of data can be stored. Data lakes provide in essence a large, distributed file system or object-store with a SQL-like query layer on top.

While these are very distinct implementations, they are actually two ways of solving the problem of bringing disparate sources of data together. Data lakes, however, can lead to many data duplicates, which bring along new concerns caused by data duplication such as additional cost, security issues and quality concerns. Loss of precision during the ETL/ELT process and increased latency are common concerns. Virtual data integration, on the other hand, has performance and scalability issues. Most importantly, maintaining consistency of the unified view over backend systems that can be changing over time is also very hard to manage. Data virtualisation is a powerful concept but requires a good answer to scalability and consistency issues. Data lakes can be distributed engineering marvels and provide immense flexibility and scalability.

At RAW Labs, we took inspiration from both “camps” so to speak. We use data lake technology in our query engine to provide large-scale caches and achieve the scalability and robustness requirements needed. However, data is always referenced from the source, as in data virtualisation. If you want to take a sneak peek on how easy it is to query data anywhere from RAW, look at some of our examples here and pick your favorite data source.

A better future

We believe there are fundamental design principles to be followed as to be able to query all the data, anywhere:

  • a declarative language;
  • a powerful data model that underlies it;
  • powerful optimizers;
  • a managed platform for the best developer experience.

This is the vision we are building towards at RAW, which will enable everyone to query all the data, anywhere.

Stay around to learn more or join us on Discord to leave your thoughts.